Statistical Analysis of Relationships between Monthly Maximum Temperatures in Iran and Global Mean Land-Ocean Temperature Anomalies
Author(s):
Abstract:
Global warming and the meaningful relationship between temperature and precipitation changes over different areas of the earth with temperature increment of the earth, are considered as the most important patterns of this century’s climate changes. Today, there is debate over climate change and global temperatures increasing. Damaging effects of this phenomenon on the planet is one of the most challenging issues in global scale. Because of this, the research ahead is done for the detection of global warming on maximum temperatures, monthly and periodic (hot and cold) as well. For this study, two groups of data, temperature data of 17 synoptic stations and corresponding amounts of data in global temperature anomalies were figured out over 60 years period of time (1951 to 2010). Goals, the Pearson correlation method for detecting relationships between datas, linear and polynomial regression for trend analysis time series data, To illustrate the correlation between the spatial distribution of temperature data with global warming stations nationwide Geostatistical model Finally, non-parametric test for detecting significant temperature change Man - Kendall were used. According to the results impact of global warming on the maximum temperature in the cold months like January, December and November should be much lower, and the highest in spring and summer season in the southern stations such as Abadan, Ahwaz and Shiraz seen. The above process is also evident in periods of hot and cold temperatures and the influence of the stations temperature of the warm period of global warming were higher than cold period and represent an increase in the temperature of the warm period of years. In between, the number of stations as well as Anzali, Urmia and Khorramabad stations in some months had the opposite influence of global warming and seen drop in the maximum temperatures of them. It is also observed in the results obtained from the analysis period. Station's maximum temperature trend change is represents significant in the summer month. Changes trend in the months of July, August and September, is significant that the process is more pronounced in the southern stations. Significant analysis trend changes have been taken in periods (cold and hot) in studied stations indicative of its significance in warm period.
Keywords:
Language:
Persian
Published:
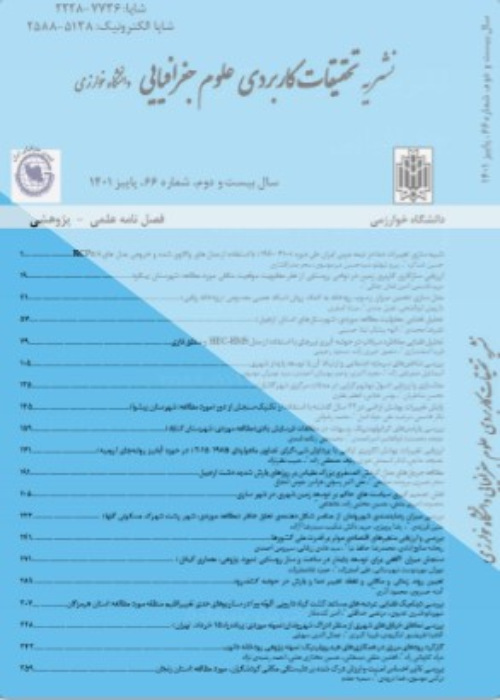
Journal of Applied Researches in Geographical Sciences, Volume:15 Issue: 36, 2015
Page:
181
magiran.com/p1415447
دانلود و مطالعه متن این مقاله با یکی از روشهای زیر امکان پذیر است:
اشتراک شخصی
با عضویت و پرداخت آنلاین حق اشتراک یکساله به مبلغ 1,390,000ريال میتوانید 70 عنوان مطلب دانلود کنید!
اشتراک سازمانی
به کتابخانه دانشگاه یا محل کار خود پیشنهاد کنید تا اشتراک سازمانی این پایگاه را برای دسترسی نامحدود همه کاربران به متن مطالب تهیه نمایند!
توجه!
- حق عضویت دریافتی صرف حمایت از نشریات عضو و نگهداری، تکمیل و توسعه مگیران میشود.
- پرداخت حق اشتراک و دانلود مقالات اجازه بازنشر آن در سایر رسانههای چاپی و دیجیتال را به کاربر نمیدهد.
In order to view content subscription is required
Personal subscription
Subscribe magiran.com for 70 € euros via PayPal and download 70 articles during a year.
Organization subscription
Please contact us to subscribe your university or library for unlimited access!


