فهرست مطالب

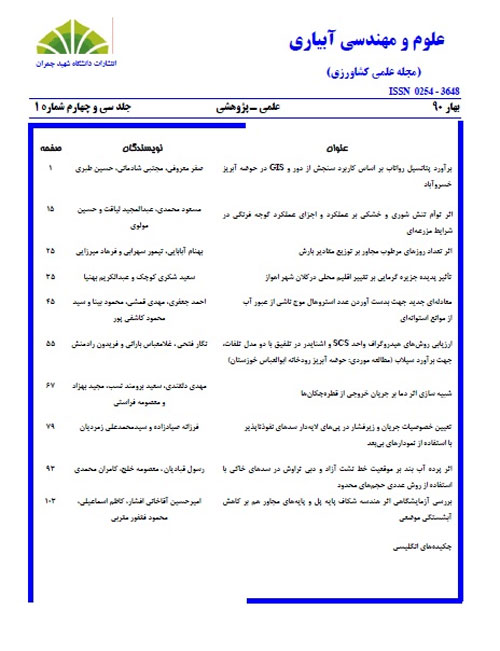
فصلنامه علوم و مهندسی آبیاری
سال سی و چهارم شماره 1 (بهار 1390)
- تاریخ انتشار: 1390/03/20
- تعداد عناوین: 4
-
- مقاله پژوهشی
-
صفحات 1-13رواناب یکی از پارامترهای مهم چرخه آبی طبیعت و مدیریت منابع آب حوضه های آبریز میباشد. در این تحقیق از تکنیکهای سنجش از برای برآورد پتانسیل رواناب حوضه خسروآباد، واقع در استان همدان استفاده گردید. بدین منظور ابتدا لایه های موضوعی مختلفی GIS دور و از قبیل نقشه های کاربری اراضی و پوشش گیاهی، مدل رقومی ارتفاع، شیب، نقشه گروه هیدرولوژیکی خاک و موقعیت زیرحوضه های منطقه تهیه شدند. سپس با استفاده از لایه های اطلاعاتی تهیه شده، یک روش وزندهی جهت تعیین پتانسیل رواناب منطقه بکار گرفته شد. همچنین به منظور بررسی تغییرات مکانی رواناب، پتانسیل برآورد شده در مناطق مختلف حوضه به چهار رده کم، متوسط، زیاد و خیلی زیاد که برای سه وضعیت شرایط رطوبتی پیشین خاک (خشک، نرمال و مرطوب) تعیین شده بود، مورد مقایسه SCS طبقهبندی گردید و با روش قرار گرفتند. نتایج به دست آمده بیانگر آن است که روش وزنی قادر به برآوردی قابل قبول از توزیع مکانی رواناب میباشد و از این روش می توان جهت برآورد پتانسیل سیلخیزی به خصوص در هنگامی که کمبود داده ها وجود دارد، استفاده نمود. همچنین این نتایج نشان میدهند که با افزایش رطوبت از وضعیت خشک به مرطوب، میزان شماره منحنی در حدود 30 درصد افزایش می یابد.کلیدواژگان: بارندگی، رواناب، شرایط رطوبتی پیشین، GIS
-
صفحات 15-23تنش شوری و خشکی یکی از مشکلات تولید فراورده های کشاورزی در بسیاری از نقاط دنیا و به ویژه مناطق خشک و نیمه خشک است. لذا این تحقیق به منظور بررسی اثر توآمان تنش شوری و خشکی بر عملکرد و اجزای عملکرد گوجه فرنگی (رقم جهت به کارگیری در برنامه ریزی مدیریت آبیاری در منطقه کرج اجرا شد. آزمایش به صورت فاکتوریل در قالب (Super Strain B طرح کاملا تصادفی با سه تکرار شامل دو فاکتور شوری و آب آبیاری اعمال شد. چهار سطح شوری آب آبیاری شامل ،W دسی زیمنس بر متر و سه سطح آب آبیاری شامل آبیاری کامل ( 100 نیاز آبی) = 1 S4= و 12 S3=8 ،S2=4 ،S1=0/ (آب شرب) 7 بود که در یک خاک با بافت شنی لومی اعمال شدند. نتایج نشان داد که با افزایش شوری و تنش W3 = %50W و 1 W2 = %75W1 و حداقل آن W1S 3 کیلو گرم در متر مربع) مربوط به تیمار 1 / خشکی، مقدار عملکرد محصول کاهش یافت و حداکثر عملکرد ( 91 بود. شوری، کمآبیاری و اثر متقابل شوری و کمآبیاری بر وزن خشک اندام W3S 0/789 کیلو گرم در متر مربع) مربوط به تیمار 4 ) هوایی، طول ریشه و تبخیر و تعرق گوجه فرنگی در سطح یک درصد اثر معنیدار داشت اما بر تعداد میوه اثر معنیدار نداشت. W3S بیشترین و تیمار 4 W1S همچنین اثر متقابل شوری و کمآبیاری بر ارتفاع گیاه و وزن خشک گیاه اثر معنیدار نداشت. تیمار 1 کمترین رشد رویشی را در طول فصل رشد داشتند.کلیدواژگان: نش شوری و خشکی، عملکرد، گوجه فرنگی
-
صفحات 25-34مقدار بارش در روزهای مرطوب منفرد (کلاس صفر ) معمولا کمتر از مقدار بارش در روزهایی است که در میان روزهای مرطوب دیگر واقع شده اند (کلاس دو ). همین ویژگی در روزهای او ل و آخر سری روزهای مرطوب (کلاس یک ) نیز دیده می شود و مقدار بارش در این روزها از روزهای کلاس دو کمتر است . در بسیاری از مناطق، اختلاف مقدار متوسط بارش در این کلاس ها قابل توجه است. در این مطالعه، اطلاعات بارش روزانه پنج ایستگاه گرگان، باب لسر، نوشهر، رامسر و بندرانزلی در شمال و شمال غربی ایران، براساس تعداد روزهای مرطوب مجاور، به کلاسهای صفر، یک و دو تقسیمبندی شدند. به منظور بررسی اثر تعداد روزهای مرطوب مجاور بر روی توزیع مقادیر بارش، توزیعهای مختلف برروی سه مجموعه داده مورد آزمون قرار گرفتند: 1) تمامی کلاسهای بارش در کنار یکدیگر، 2) کلاس صفر جداگانه و کلاس یک و دو درکنار یکدیگر و 3) هر کلاس بصورت جداگانه . نتایج مطالعه نشان داد که استفاده از مدل های مجزا برای کلاس های مختلف بارندگی در تمامی ایستگاه ها منجر به برازش بهتری می شود. مقدار شاخص در مدل های مورد آزمون، با تفکیک کلاس ها کاهش معنی دار پیدا کرد. در بین چهار توزیع مورد بررسی (گاما، لوگ نرمال، AIC نمایی مرکب و ویبول)، در اکثر موارد توزیع نمایی مرکب و در یک مورد، توزیع لوگ نرمال دارای عملکرد بهتری بود.کلیدواژگان: کلاسهای بارندگی، توزیع مقادیر بارش، روزهای مرطوب مجاور، آزمون نسبت لگاریتم درستنمایی
-
صفحات 35-43توسعه افقی و عمودی شهرها و روند رو به رشد فعالیتهای صنعتی در آنها منجر به تغییرات زیادی در خصوصیات فیزیکی سطح زمین، انرژی آزاد شده، آلودگی هوا، دما و درنتیجه سبب تغییر اقلیم محلی در کلان شهرها گردیده است. شهرها اغلب گرمتر از محیط اطرافشان هستند. این پدیده به وسیله اختلاف معنی دار بین انرژی شهرها و حومه آن تعیین میشود. برای تعیین این تغییرات در کلان شهر اهواز، داده های هواشناسی ایستگاه های سینوپتیک اهواز و دزفول در طی یک دوره 44 ساله مورد بررسی و 3/375 و °C مطالعه قرار گرفتند. بررسی داده ها نشان داد که میانگین سالیانه دمای حداقل اهواز در 44 سال دارای روند افزایشی 0/077° ) است. این در حالی است که میانگین سالانه دمای حداقل دزفول فاقد تغییر بود. نتایج روند افزایشی C/1yr) در یک سال دما در اهواز نسبت به دزفول روند فزاینده را نشان میدهد که ناشی از اثر جزیره گرمایی شهر اهواز و حاکی از عدم توسعه یافتگی 4/14 و در یک °C شهر دزفول در گذر زمان میباشد. بیشترین میزان افزایش میانگین ماهانهی دمای حداقل اهواز در 44 سال 0/047 ) درماه اسفند است. °C/1yr) 2/07 و در یک سال °C 0/094° ) در ماه آذر و کمترین مقدار آن در 44 سال C/1yr) سال معمولا وسعت و گسترش شهر موثرترین عامل در شدت جزیره گرمایی شناخته می شود و از عوامل مهمی که سبب افزایش شدت اثر جزیره گرمایی و در نتیجه تغییر اقلیم محلی در کلان شهرها گردیده، رشد جمعیت میباشد و جمعیت را به عنوان پارامتری که بیانگر اندازه شهر است.کلیدواژگان: زیره گرمایی، اقلیم محلی، سری زمانی، روند افزایشی، رشد جمعیت
-
Pages 1-13Runoff is one of the important parameters in hydrologic cycle and water resources management of basins. In this research, Remote Sensing (RS) and Geographic Information System (GIS) techniques were used for runoff potential estimation in Khosro-Abad watershed, located in the Hamedan region. In this regard, first, the various thematic maps layers such as Digital Elevation Model (DEM), land use and land cover, slope, soil hydrologic groups and sub-basins location were prepared. Then, based on the prepared thematic layers, a weighting method was developed to runoff potential estimation of the area. To spatial runoff variability investigating, the classifieds estimated runoff potential (low, medium, high and extreme classes) was evaluated using the SCS method. The SCS method was estimated based on three previous soil moisture conditions (dry, normal and wet). The results showed that the weighting method is enable to runoff potential estimation. This method can be proposed for runoff potential estimation especially in the cases that the needed data were missed. The results also
showed that with the previous soil moisture increasing (from dry to wet conditions), the CN increase about 30%.Keywords: rainfall, Runoff, Previous soil moisture, GIS -
Pages 15-23Salt and drought stress is one of the main problems of Agricultural production in many parts of the world, especially in arid and semi-arid area. Therefore, this study was conducted to investigate the effect of both stresses (individually and simultaneously) on yield and yield component of tomato (Super Strain B) in order to program irrigation management in Karaj. The experiment was carried out as Factorial on base of complete randomized design with three replicates including two factors: Salinity and irrigation water. Salinity and irrigation water factors consisted of four levels (S1=0.7, S2=4, S3=8 and S4=12 dS/m) and three levels (W1=100, W2=75 and W3=50 percent of water requirement), respectively. The soil texture was sandy loam. The results of this study showed that the yield production reduced by increasing salinity and drought stresses. The maximum yield (240.7 g) was corresponded to W1S1 treatment and the minimum yield (48.58 g) was corresponded to W3S4 treatment. Salinity, deficit irrigation and their interaction had significant effect (pKeywords: Salinity, drought stress, Tomatoes, Yield
-
Pages 25-34The amount of daily rainfall for a solitary wet day (Class 0) is normally less than the rainfall for a wet day that is enclosed by wet days on either side (Class 2). The same characteristics hold true for the case of the first or last day of wet spells (Class 1) and there fore the rainfall here is found to be smaller than the Class 2 rainfall. In many regions, there exist large differences between these rainfall classes. In this study, the daily rainfall data from 5 rain gauge stations in the north and northwest of Iran are classified to classes 0, 1 and 2 according to the number of adjoining wet days. To examine the impact of adjoining wet days on the distribution of rainfall amounts, different distributions were tested with 3 different data sets: (1) all rainfall classes grouped together, (2) solitary wet days fitted separately from other wet days, and finally (3) all rainfall classes separately. The results showed that the models which treat the rainfall classes separately are a better fit for all the 5 stations. The Akaike Information Criterion (AIC) values are significantly reduced as the rainfall data are split into rainfall classes. Also, among 4 different distributions considered (Gamma, Lognormal, Mixed Exponential and Weibul), mixed exponential distribution in most cases and lognormal distribution in one case showed better performances.Keywords: Rainfall classes, Rainfall amounts distribution, Adjoining wet days, Log likelihood ratio test
-
Pages 35-43Vertical and horizontal extension of cities and growing trend of industrial activities in them has resulted in wide changes on ground physical properties, released energy, air pollution, temperature and as a result change of local climate in metropolises. Cities are often warmer than their environment. This phenomenon is determined by the difference between cities energy and their environments energy. Synoptic climatology data of Ahvaz and Dezfool in a 44- year period was surveyed and studied to specify these changes in Ahvaz metropolis. The results showed that annual average minimum temperature of Ahwaz in this period has a total increasing trend of 3.375 °C and (0.077 °C/1yr) yearly, whereas the corresponding parameter was without any changes in Dezfool. Temperature increasing trend in Ahwaz in comparison with Dezfool as indicated by the results which is resulted by the heat island effect in Ahwaz and the lack of development of Dezfool with time. The greatest increase rate of Ahwaz average minimum temperature is 4.14 °C and (0.094 °C/1yr) yearly in Azar monthly in this period and the smallest is 2.07 °C and (0/047 °C/1yr) yearly in Esfand monthly. Usually the extent and extension of the city are known as the most important factors in the severity of heat island effect, and population growth is among the serious factors which cause the increase of its severity and finally result in the change of local climate of metropolis. Population is considered as
parameter which is explanatory of citys size. In this study, a relationship has been developed for the average intensity of heat island effect in Ahwaz and the logarithm of population.Keywords: Hest island, local climate, Time series, increasing trend, population growth


